The U.S. Ad Market Tracker rose 2.5% in May, the first expansion in 11 months. The expansion compares with the year-ago period that was only up modestly and is the best May since Standard Media Index began tracking it. The growth is the first material sign that the U.S. ad marketplace is pulling out of a recession that began in July 2022, based on the SMI data, which is derived from a pool of actual ad spending processed by the major agency holding companies and independent media services agencies.

Although December’s national linear TV ad spending improved compared to previous months, it still declined 2%, according to Standard Media Index — to roughly $3.7 billion. Looking at the entire fourth quarter, the national TV marketplace was down 6% — an improvement from the 16% decline of the third quarter. For the calendar year 2022, national TV ad spend was down 5% versus the 2021 year — and 14% lower than 2019.

The 2022 U.S. ad market expanded a little more than 3% over 2021, according to a MediaPost analysis of 12 months of data from Standard Media Index’s U.S. Ad Market Tracker. The analysis — a simple, unweighted average of monthly year-over-year percent changes during 2022 — does not account for actual monthly ad-volume differences, and precedes an explicit annual analysis expected to be released by SMI soon.
November’s national TV advertising narrowed its spending losses from the preceding months due to the NFL programming and games that were in full swing — down 2% from the year-ago period, according to Standard Media Index. Still, it wasn’t all good news. Although NFL and college football brought in a collective $1.1 billion for the month, SMI says the NFL lost 15% in national TV advertising dollars for November versus the same period a year ago.
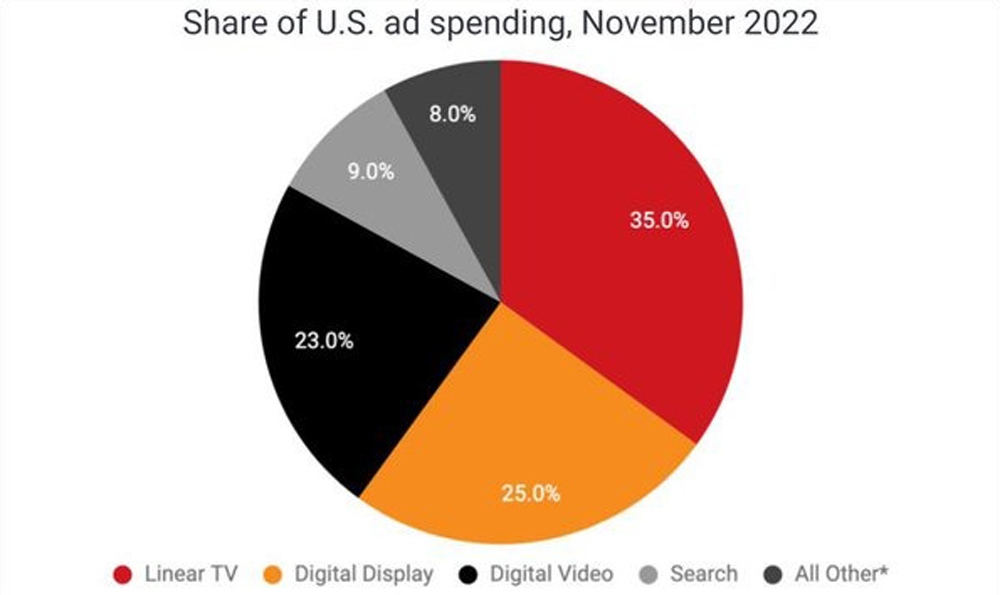
For the first time since July 2020, digital ad spending declined in November, according to new data from Standard Media Index (SMI). The analysis also is the first from SMI to include new media breaks based on ad formats, and shows that a new break for “digital video” rose 7% in November, helping to offset digital’s overall 1% decline in November. The data also shows linear TV ad spending fell 12%, driving the share of U.S. ad spending for the long-dominant medium to 35% vs. 23% for digital video, which includes any digital ad format running on websites, platforms or CTV apps and devices.
The scatter television advertising market — the near-term buying of TV media — is revealing a dramatic national linear TV ad market slowdown in the fourth quarter so far, according to Standard Media Index. Through October, scatter advertising has dropped 39% versus the same period a year ago. It is also down 56% from 2020.
Exclusives


National linear TV advertising remained virtually flat in September — the start of the new TV season and major sporting events — versus a year ago, inching up a tiny 0.3%, according to Standard Media Index, to just under $4 billion. But SMI says this was due to the absence of some key sports events that ran a year ago — including the Ryder Cup golf tournament.
The U.S. ad economy continued to recede for the third consecutive month in August, albeit at more moderate rate than July’s nearly 13% decline, according to a MediaPost analysis of data from Standard Media Index’s just-updated U.S. Ad Market Tracker. With better comps vs. year ago numbers, U.S. ad spending declined only 3.3% in August vs. the same month a year ago.

Advertising spending on national linear TV fell 1% in June to $3.138 billion, according to new figures from Standard Media Index. Spending on cable TV dropped 12% to $1.946 billion, while broadcast increased 23% to $1.05 billion, SMI said. Syndication grew 33% to 142.2 million.
Standard Media Index, which collects and analyzes advertising spending data, said that it has been acquired by private equity firm GTCR and that James Fennessy is stepping down as SMI’s CEO. The move comes at a time when money is pouring into companies in the data and ad tech businesses.

Traditional legacy TV has seen higher “effective” cost-per-thousand prices for deals in the TV upfront ad markets over the last three TV seasons, according to Standard Media Index — but with lower total upfront advertising spend in key dayparts. SMI says the trend is expected to continue for the next TV upfront ad market, set to begin in a few weeks.
After a 3% increase in March, advertiser spending on national television finished the first quarter up 6%, according to new figures from Standard Media Index. The increase left the industry 0.3% ahead of where it was in the first quarter of 2020, just as the COVID-19 pandemic was starting to affect the U.S. Broadcast TV was up 15% in the quarter compared to 2021, helped by the Winter Olympics on NBC. Cable was up 2%. Syndication was down 14%. Cable had a 54% share of linear ad dollars, compared to broadcast’s 43% share.

The U.S. advertising marketplace has expanded for a full year — 12 consecutive months — in February, according to just-refreshed data from Standard Media Index’s U.S. Ad Market Tracker, a collaboration with MediaPost. Ad spending expanded 14.7% in February, meaning that with the exception of December 2021’s tepid 1.4% growth, every month has increased at healthy double-digit gains since coming out of the advertising recession in March 2021.
Linear TV advertising sales slowed in February, leaving year-to-day linear TV investments up 6% so far this year compared to last year, according to Standard Media Index. In January, linear TV sales were up 9%. But sales remain down from 2020, before the COVID 19 pandemic hit the U.S. Compared to 2020, linear television ad sales are down 6% so far this year.
The Comscore/SMI eCPM solution provides unified metrics for evaluating, planning and optimizing audience-based campaigns on TV.
National television advertising spending rose 9% in January from a year ago, according to new data from Standard Media Index. SMI said that broadcast TV was up 19%, while cable was down 3%. As usual, digital was a big gainer, jumping 27%.

Linear television advertising spending fell 1% in November compared to a year ago, with local cable operators chalking up big gains, according to new figures from Standard Media Index. National broadcast and cable networks were each down 2% for the month. Local TV station ad sales were down 9% compared to the 2020 election year.
According to the Standard Media Index Fall TV Season Preview Report, the 2020-21 national linear TV season ad revenue fell 10% due to COVID impact on production and scheduling, pre-existing trends in linear ratings declines; while eCPMS grew across key dayparts.
The U.S. ad economy expanded 35.2% in June vs. the same month a year ago, marking the fourth consecutive month of expansion since the ad industry pulled out of its COVID-19 recession. It was the best June ever since Standard Media Index began the U.S. Ad Market Tracker, though it represented only a slight 0.3% increase over June 2019.
National TV advertising in June declined 9% to $3.2 billion — a much smaller decline than the two previous months, according to Standard Media Index. In April, in the thick of the COVID-19 pandemic downturn, there was a massive loss of 28%, followed by a 19% decline in May. Overall, the second quarter witnessed a 19% decline in the March to June period.
More people continue to watch TV or other forms of video in the midst of the pandemic, but Madison Avenue is spending fewer dollars to dazzle them. National TV advertising fell 9% in June to $3.2 billion, according to Standard Media Index, a continuation of negative trends that have been in place since the coronavirus pandemic struck in March. But the June figures show losses narrowing: the 9% figures come after a 19% dip in May and a 28% tumble in April.
October’s national ad market was up 7% over the same period a year ago, according to Standard Media Index. Breaking down the national TV category, broadcast networks dropped 7% in media spend, with cable networks 5% higher. Digital was up 17%.
Standard Media Index and Nielsen establish a relationship to fuel SMI’s AccuTV with Nielsen Ad Intel data.
Unfavorable comparisons to the Summer Olympics last year may be behind the August slide, but the good news is that U.S. advertising is still up 2.4% for the year-to-date according to Standard Media Index.
Fox received a major boost in TV ad spending in February thanks to the Super Bowl, but overall the broadcast industry remained mostly flat, according to Standard Media Index. Broadcast entertainment ad revenue dropped 6.4% across all dayparts, but spending on broadcast news increased 15.1%.
The demise of last fall’s two biggest fantasy football players turned into an ugly reality for broadcasters’ bottom lines in September. According to new data from Standard Media Index, broadcast television spend fell 13.2% in September versus the previous September, when revenue swelled because of the freewheeling spending of dueling fantasy football companies DraftKings and FanDuel. Those companies — which rose quickly last year and fell even quicker — spent nearly $100 million less last month across broadcast and cable than they did the previous September.
New info from Standard Media Index goes a long way to solving one of the biggest quandaries that TV networks currently face: proving the full extent of their importance to advertisers in comparison with digital competitors. The new data show how TV can increase advertiser sales volume when budgets removed from TV to fund digital are returned even partially to TV.
If a historical upfront marketplace adage is true — that a tight scatter market presages strong upfront demand — then the 2016-17 upfront marketplace could well be a robust one, according to never-before-seen data analyzing the share of spending growth of upfront vs. scatter markets. The data, provided by Standard Media Index, shows that while upfront spending has risen 3% through the first seven months of the 2015-16 broadcast year (October-through-April), the scatter marketplace has expanded nearly four times that rate: +19%.
Over two years, seven consumer product group [CPG] brands and five non-CPG brands saw revenues jump by 14.6% on average, according to new research. These 12 advertisers averaged a 25.8% rise in their TV ad spend over the period. Three CPG companies averaged a sales increase of 4.6 times the incremental TV ad spend after they switched dollars back to TV.
Strong broadcast network TV advertising dollars continued in January amid a slowly rising overall ad marketplace. Standard Media Index says growth of 74% in January helped to lift overall broadcast TV spending 9%, when including upfront and scatter dollars placed during the month.
The U.S. advertising market continues on its torrid pace — with both digital and TV advertising moving higher versus earlier levels in 2015 and against the same month in 2014. National TV advertising grew 17% to a 198.5 index over November a year ago, and 23% higher from the 161 index in October.
Never mind the gloom and doom over online encroaching on the No. 1 medium. TV ad spending in November was downright robust, according to the latest data from Standard Media Index, which tracks ad spending on the part of 80% of U.S. agencies. It rose 17% over last year, including a gain of 15% for broadcast, which had been lagging earlier this year.
A flood of retail spending on back to school promotions lifted the U.S. media economy to its best month this year, according to the Standard Media Index, which tracks ad spending on the part of 80% of U.S. agencies.
For August, total broadcast TV networks’ media business was down 6% on a year-to-year basis in the month, with cable TV networks up slightly by 3%, according to the Standard Media Index. TV was up overall in August, 3%. Spot TV gained 17%; syndication dropped 2%; and local cable picked 11%.
Digital Media Siphons $1 Billion From TV
Over the course of the 2014-15 broadcast season, digital media siphoned off more than $1 billion from the national TV market, with the vast majority of those dollars being drained out of the Big Four networks. According to new research from Standard Media Index, about $1.1 billion in national TV spend was rerouted to digital, of which a staggering 87%, or $960 million, was plundered from broadcast.
Digital Up, TV Dips In 4Q Media Spending
A marked slowdown in the last quarter of 2014 occurred in the U.S. advertising market. Standard Media Index says the market was flat in the fourth quarter of 2014 versus the same period in 2013. Only digital media spending witnessed a rise, up 15% versus the same time period a year ago to $7.6 billion. More traditional TV media moved in the other direction. National broadcast TV spending was down 2% to $4.8 billion, and cable TV gave up 1.6% to $6.8 billion during the period.
Broadcast, Cable Scatter Volume Dips
For some, the second-quarter TV scatter market is always a barometer of how the upfront TV market — for the TV season to follow — will perform. A new research report confirms that assumption. Standard Media Index says that both broadcast and cable networks took a hit in scatter volume during the second quarter of this year.
In a move that will give it greater visibility into the shares of ad dollars that agencies spend across media, Turner Broadcasting System has signed on to license actual agency “booking” data from Standard Media Index. Turner is the second major cable networks group to subscribe to the data, following A&E Networks, which began using SMI’s data in April.