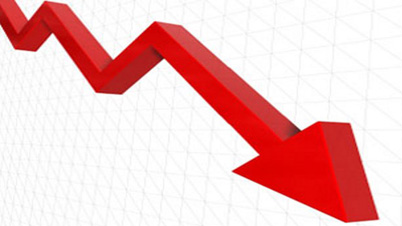
Midyear Broadcast TV Ad Spend Declines

At the close of the second fiscal quarter and in the ramp up to the 2018 midterm elections, a new report shows that the U.S. witnessed a 0.35% year-over-year contraction across broadcast, digital broadcast and radio platforms — demonstrating flat growth.
This figure comes despite the emergence of political advertising spend in primary Democrat and Republican elections, which has seen a 264% growth rate. When excluding political ad spend from the findings, broadcast, digital broadcast and radio witnessed an overall 4.90% contraction compared to last year at the same time.
The findings come from Matrix Solutions’ 2018 Midyear Ad Spend Report, an update on the state of the advertising spend ecosystem providing insights derived from the activity of more than 10,000 users within media ad sales teams from January 2018 to June 2018.
“According to our data, overall ad spend throughout the year, to date, has remained relatively flat when including the buoyancy that always comes from political campaigns, and without there’s a clear contraction,” said Mark Gorman, CEO at Matrix Solutions.
“It’s a trend that’s continued from the findings of our 2017 Ad Spend Report, which means for these traditional platforms, they need to better arm themselves to grab a larger slice of the overall advertising spend pie to remain competitive,” he added. “The advertising industry is in constant flux, and understanding these trends can help media ad sales teams better anticipate how brands are investing in traditional media platforms to inform their own strategies and priorities.”
Advertising Spend By Platform
Broadcast
- When excluding political ad spend, overall media ad sales in broadcast experienced a contraction rate of 5.86% and remains mostly flat with a slight contraction rate of 0.83% when including political ad spend
- Key industries of growth in broadcast include services (4.98%), travel and leisure (2.56%) and financial services (2.26%).
- Notable areas of decline in broadcast include grocery and food items (21.54% contraction rate), restaurants (19.68% contraction rate), automotive and auto-related (12.51% contraction rate) and health and beauty (11.77 contraction rate).
Digital Broadcast
- Digital broadcast is booming — media ad sales grew across nearly every category at an average rate of 13.21% when including political ad spend, and at 13.03% when excluding political.
- Key industries of growth include financial services (23.09%), services (20.71%), home improvement (16.03%), entertainment (24.01%) and medical (10.46).
- Notable areas in decline include trade organizations (19.10% contraction rate) and automotive and auto-related (2.12% contraction rate).
Radio
- Radio’s growth is flat in comparison to last year, with a slight contraction of 0.38% when excluding political ad spend. When factoring political, that figure slightly jumps but growth remains flat at 0.06%.
- Key industries of growth include services (21.05%), retail (19.31%) and financial services (17.49%).
- Most significant declines are in travel and leisure (37.27% contraction rate), health and beauty (31.64% rate), automotive and auto-related (22.5% contraction rate) and entertainment (16.82 contraction rate).
Advertising Spend By Industry
When looking at ad spend figures from specific industries, the following categories were key areas of growth across broadcast, digital broadcast and radio:
- Services (6.62% growth)
- Financial services (5.16% growth)
- Home improvement (0.54% growth)
In the same vein, the following categories were in decline across the three platforms in the U.S.:
- Automotive and auto-related (27.15% contraction)
- Grocery and food (19.49% contraction)
- Restaurants (18.53% contraction)
Both the restaurants and automotive and auto-related sector have continued to see a decline in advertising spend among traditional media platforms, continuing a trend unearthed in Matrix’s 2017 Ad Spend Report which found that restaurants had a contraction rate of 5.87% and automotive and auto-related with a contraction rate of 9.98%.
National Vs. Local Spending
Even when factoring in political ad spend, local advertising is down with a 2.89% contraction rate, but national ad spend is surging with a growth rate of 4.69%. When excluding political ad spend, local continues to be down at a 3.25% contraction rate, with national at a contraction rate of 0.77%, demonstrating flat growth at a national level without a political factor.
Methodology
Matrix Solutions looked at $11 billion worth of media ad sales deals to see which categories and platforms were most popular across the media ad sales industry in the United States — normalizing each category across more than 10,000 unique active users in broadcast, digital broadcast and radio. Data was captured from January 2018 to June 2018.
Click here to read the full report.


















Comments (0)