Although household TV ad impressions and TV advertising airings grew in 2023, national TV advertising spend fell 4.7% to $43.71 billion versus 2022, according to iSpot.tv. For much of the first half of the year, there was widespread softness in the TV advertising market — especially in near-term “scatter” market deal-making. There were also unfavorable comparisons to the year before, when the Winter Olympics aired and mid-term political elections were held.

Independent credit ratings service S&P Global Ratings kicked 2024’s advertising outlook off on a stronger-than-expected note, issuing a forecast that U.S. ad spending will rise 7.6% — nearly two percentage points greater than the most recent agency holding company composite, which projects a U.S. growth rate of 5.8%. Interestingly, S&P’s outlook is even more bullish than the most optimistic holding company forecasting unit — IPG Mediabrands’ 7.2% U.S. ad-growth projection.
The U.S. ad market expanded for the eighth consecutive month in November — albeit at mostly modest rates, according to a revised analysis of Guideline’s U.S. Ad Market Tracker. The tracker, an index of U.S. ad spending derived from actual media buys processed by 12 of the largest U.S. agencies’ — including the six major agency holding companies and major independent media services — billing systems.
Big U.S. companies including Walt Disney and Comcast increased advertising spending on Instagram after pausing commercials on X last month, according to Sensor Tower, as marketers flee the Elon Musk-owned social media platform over antisemitic content. Disney (DIS.N) and Comcast (CMCSA.O) lifted their U.S. spending on the app owned by Meta (META.O) by 40% and about 6% respectively in the two weeks from Nov. 20, Sensor Tower data showed. Paramount (PARA.O), meanwhile, tripled its spending on Snapchat.


The U.S. ad market expanded for its fourth consecutive month in October, rising 3.2% over October 2022, according to just-updated data from Guideline’s U.S. Ad Market Tracker. It was the biggest gain since July’s 6.2% gain, and is an indicator that the ad spending from the major agency holding companies and biggest independent media agencies has pulled out of recession — at least for now.
Exclusives


The U.S. ad market rose just 0.1% in September vs. the same month a year ago, but it nonetheless marked the third consecutive monthly gain, following a protracted period of sequential declines. While not necessarily great news amid growing concerns that the macro economy remains uncertain, including speculation over another U.S. and possibly global recession, it’s not terrible news either.

Globally, consumer spending on media — both content and technology — decelerated to 6.3% (rising to $2.186 trillion) in 2022, following 2021’s 6.9% surge, which was the strongest growth in a decade.
Although December’s national linear TV ad spending improved compared to previous months, it still declined 2%, according to Standard Media Index — to roughly $3.7 billion. Looking at the entire fourth quarter, the national TV marketplace was down 6% — an improvement from the 16% decline of the third quarter. For the calendar year 2022, national TV ad spend was down 5% versus the 2021 year — and 14% lower than 2019.
The U.S. ad market declined for he fifth consecutive month in October, continuing a downward slide mirroring the downturn in the U.S. and global economies, according to a MediaPost analysis of Standard Media Index’s U.S. Ad Market Tracker.

U.S. ad spending expanded for the 14th consecutive month in April, rising 4.3% over the same month a year ago. More significantly, April represented a 60% expansion over April 2020, which was the low point of the COVID-19-related ad recession two years ago. The data, which comes from U.S. Ad Market Tracker, a collaboration of Standard Media Index and MediaPost, also shows smaller advertisers and categories continue to lead the expansion, while the top 10 were essentially flat — rising only 0.5% over April 2021, although the group gained 48.8% over April 2020.

Media agency Zenith is forecasting a decline in U.S. TV ad spending in 2021 as audiences shrink and marketers pour their advertising dollars into digital video. “Audiences continue to migrate online, and online video viewing is growing rapidly, even as traditional television ratings shrink again after a one-off spike when lockdowns began in 2020,” Zenith said in its report. “Advertisers value online video as a means of maintaining reach while television declines, but it’s an effective form of brand communication in its own right.”
The U.S. ad economy expanded 35.2% in June vs. the same month a year ago, marking the fourth consecutive month of expansion since the ad industry pulled out of its COVID-19 recession. It was the best June ever since Standard Media Index began the U.S. Ad Market Tracker, though it represented only a slight 0.3% increase over June 2019.

Consumers are ready to travel but the industry is still playing catch-up, including in its advertising efforts. That’s according to a report from MediaRadar that looks at cruise and airline ad spending across digital, TV and print. Overall, airline and cruise ad spending is building, but is far from 2019 levels.
While Google and Facebook remain the world’s biggest advertising behemoths, four of China’s media companies now rank among the world’s top 10, including TikTok owner Bytedance, which barely even existed just a few years ago. The findings are based on estimates just released by GroupM’s Business Intelligence unit, and are pro-forma calculations based on an analysis of advertising revenue estimates from company reports.
Monthly U.S. ad spending pacing has improved consistently since the ad recession began earlier this year following the U.S. pandemic lockdown, but there was a slightly negative blip in August, according to a tracking study of ad executives’ “run rates,” compiled by Wall Street equity research firm Pivotal Research Group.

Advertising spending is due to decline 9.1% in 2020 due to COVID-19, according to a new forecast by media agency Zenith. Regionally, the U.S. is benefiting from political spending ahead of the November elections, with the decline projected at 7% in 2020. Zenith now forecasts that digital advertising will account for 51% of global ad spend this year, up from the 49.5% it forecast in December.

After a day of NewFronts panels in which multiple presenters talked about consumers’ accelerated migration from linear to streaming during the pandemic, the Interactive Advertising Bureau released its annual video ad spend study, which indicates that many buyers are starting to shift some of their broadcast and cable ad spend to connected TV.
Across channels, the travel industry is dramatically cutting ad budgets in response to the coronavirus pandemic. Comparing the first half of February to the first half of March, digital and TV ad spending tumbled by 44%, according to MediaRadar. Year-over-year, travel investment in the first two weeks of March is down nearly 50%.
Amid concerns of a looming U.S. economic downturn, the U.S. ad market grew 7.6% during the first half of 2019 and is on track to increase a total of 6.3% for the full year, according to revised estimates released today by IPG Mediabrands’ Magna unit.

As the TV advertising market sees improvements in the second quarter — posting flat results versus declines in previous months — total TV advertising is projected to be down around 4% this year, according to one analyst. Second-quarter ad revenues were estimated to have dropped 0.5% to $12.2 billion, according to MoffettNathanson research.

A surprisingly strong May, particularly in terms of national TV ad dollars, is evidence of positive results for the upfront TV ad market, according to Standard Media Index. Average weekly ad spending on national TV networks grew 2% — from $895 million to $912 million.
GroupM issued a revised ad-spending forecast today for the U.S. predicting underlying growth (which excludes political advertising) of 5.8% for 2019. That’s just slightly lower than the 6% underlying growth GroupM says the U.S. market achieved in 2018. The WPP media unit also forecast underlying growth of 4.8% for 2020.
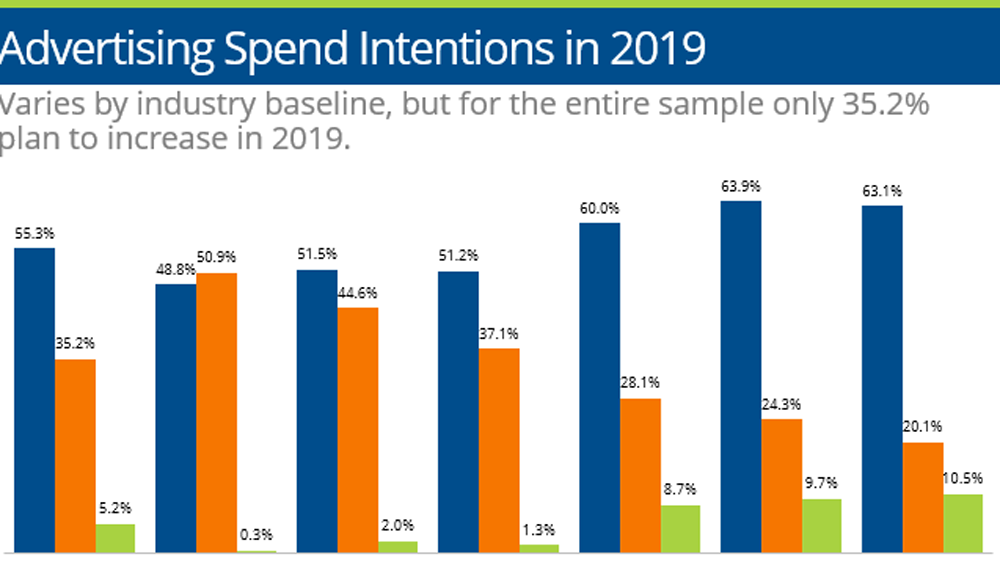
In 2019, local advertisers don’t plan on increasing their budgets. Mobile and social advertising are the two areas where advertisers indicate a willingness to increase ad spend in 2019.
U.S. ad spending expanded 4.1% in 2018, according to final estimates released late Wednesday by WPP’s Kantar Media unit. That is only slightly off the 4.2% expansion in the U.S. Gross Domestic Product. Advertisers spent $151.7 billion in 2018, across the media tracked by Kantar Media, the highest total ever.
With or without politics, broadcast TV advertising spending declines in midyear update, while digital broadcast surges. Radio remains flat. The findings come from Matrix Solutions’ 2018 Midyear Ad Spend Report, an update on the state of the advertising spend ecosystem providing insights derived from the activity of more than 10,000 users within media ad sales teams from January 2018 to June 2018.
As TV viewing continues to change, marketers are trying to keep pace. That means 2018 spending on traditional TV ads will fall by $1 billion to drop below the $70 billion plateau for the first time since 2015, according to a new forecast from eMarketer.
 Ad spending on regular season NFL games declined last year as the league continued to struggle with falling television ratings. Marketers spent $2.42 billion on in-game NFL commercials in 2017, a 1.2% decline from the previous regular season, according to Standard Media Index, which tracked outlays at NBC, CBS, Fox and ESPN. Ad spending had increased the two previous seasons. It was the first drop since the company began following football spending in 2014.
Magna Global has updated its ad forecast to reflect a slightly greater increase in spending next year, though the jump is partially offset by a slowdown in offline ad spending.
In 2017, total digital ad spending in the United States will hit $77.37 billion, or 38.4% of total ad spending, according to an eMarketer forecast. That will outpace TV ad spending, which will total $72.01 billion, or 35.8% of total media ad spending.
Total ad spending is forecast to grow an average 5% annually through 2020 according to a new report issued today by MyersBizNet. That growth is led by digital media including the digital assets of legacy media companies. Total digital advertising is predicted to increase an average 21.2% annually from $58.3 billion in 2016 to $113.3 billion in 2020. Legacy media categories, excluding their digital revenues, are forecast to decline an average 1.1% annually from $129.4 billion in 2016 to $124.7 billion in 2020.
AT&T Mobility continues to top all of its competitors in TV advertising spending in October, according to a new report from TV advertising measurement firm iSpot.tv. AT&T also led the market in TV ad spending in September and August, according to iSpot.tv, while T-Mobile US was the leader in July.
Ad spending was down another 3.9% during second quarter, according to new data from Kantar Media, following a 4% drop in first quarter. TV was down 4.5%. A few years ago, this would have been a clear indication that the media economy is struggling. But these days, with advertisers pulling back on traditional media in favor of cheaper, better-targeted new media, the declines are as much an indication of the changing industry as they are a weakness in the ad economy.
Broadcast TV outlets have been bracing for a difficult year in advertising, with ad revenues expected to fall by 6% to 9% compared to last year, according to a forecast by Moody’s Investor Service. Growth in national advertising has stalled as marketers shift their dollars to digital outlets and cable TV channels. Local advertising, the key driver for television stations, should offset the weakness in national advertising, according to Moody’s report released early Wednesday. However, the two-year outlook is particularly sunny.
What Threw A Wrench Into Media Economy
 The media economy experienced a slowdown during the final months of last year, and that trend may continue into this year. That’s because a good deal of the declines are based on longer-term changes in ad spending that will be playing out over the next few years. Jon Swallen, chief research officer at Kantar Media, talks about why the fourth quarter was so rough, how TV is shaping up for the coming year, and why newspapers are struggling.
A Disappointing Year For Ad Spending
Even years are supposed to be good ones for ad spending. There’s the Olympics, an election, and last year there was even the quadrennial World Cup. But none of those were strong enough to cancel out the bad year for traditional media, which was hit with more ad spending declines. Ultimately that led to disappointing spending in a year that was supposed to be quite strong. Ad spending was up 0.7% for the full year, according to Kantar Media, to $141.2 billion.
Some Promise For Third Quarter Ad Spending
The U.S. media economy appeared to take a step back during third quarter, with ad spending declining by 1.9%. But that dip was entirely attributable to tough year-to-year comparisons with third quarter of last year, when Summer Olympic and record political spending took place. Take out those two biannual events, and third quarter ad spending would have increased, according to Kantar Media.
Here are the most-advertised brands by 2012 U.S. measured-media spending. AT&T is No. 1 at $1.59 billion, while Budweiser is 25th at $449 million.
Kohl’s, which is without a chief marketer, plans major changes to marketing strategy — including a big boost to TV and digital spending.
An Upbeat Take On 2013 Ad Spending
STRATA, which produces media buying and selling software and monitors the deals that are made through it, says that the new year has started out stronger than many are forecasting. “We are already 3% to 5% ahead of 2012, which is interesting because there is no political advertising to support the ad economy this year,” says John R. Shelton, STRATA president-CEO.